Guides · · 6 min
Does Technical Analysis Work? What the Evidence Says
Does technical analysis work? What decades of research and 230 forex robot reviews show, and how to use charts sensibly alongside fundamentals.
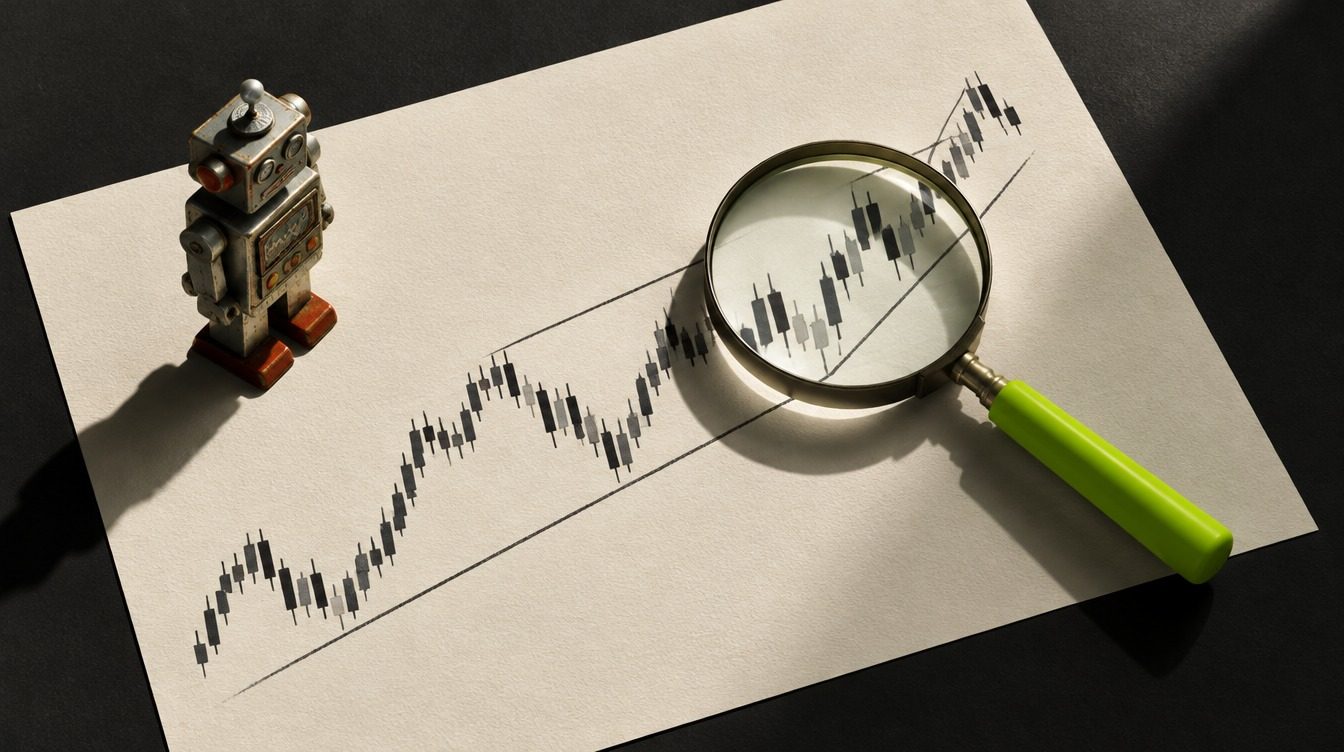
Does technical analysis work? Sometimes, and usually less well than its fans claim. Academic reviews find that simple chart rules made money in some markets and periods, but many of those edges shrank once trading costs and data-mining were accounted for. Used carefully, it is one tool in how to analyse stocks and currencies, not a shortcut to profit.
The short version
- Technical analysis studies price and volume charts to judge timing, trend and risk.
- A major 2007 review of 95 modern studies found 56 positive, 20 negative and 19 mixed results, with serious caveats about method.
- Profits tended to be stronger in currencies and futures than in stocks, and weaker in more recent data.
- Of 230 forex robots in our archive, which automate trading rules, the average score was just 4.35/10.
- It works best for entries, exits and risk control, combined with fundamentals and strict testing.
What is technical analysis in trading?
Technical analysis is the study of past prices, and often trading volume, to make decisions about future trades. Instead of asking what a company or currency is worth, a technical analyst asks what the price is doing: is it trending, stalling at a level it has turned from before, or moving faster than usual?
When traders talk about a stock's "technicals", they mean exactly this: the chart picture, its trend, support and resistance levels and readings from indicators. The main tools fall into a few groups:
- Trend tools such as moving averages and trend lines, which try to show direction.
- Momentum oscillators such as RSI and MACD, which measure the speed of moves and flag stretched markets.
- Chart patterns such as head-and-shoulders, double bottoms and breakouts from ranges.
- Volume and volatility measures, which show how much conviction or risk sits behind a move.
The idea behind all of them is the same: crowds of traders behave in repeatable ways, and those habits leave footprints on the chart. Indicators that measure buying and selling pressure, such as the Bull Power and Bear Power indicators, are typical examples.
Is technical analysis real, or just pattern-spotting?
It is a real discipline in the sense that banks, funds and millions of retail traders use it every day. The fair criticism is that it can be subjective. Two traders can look at the same chart and see different patterns, and the human brain is very good at finding shapes in random noise.
Academics have tried to remove that subjectivity by turning chart patterns into exact, testable rules. In one well-known paper, Lo, Mamaysky and Wang's study of technical pattern recognition used an automated method on US stocks from 1962 to 1996 and found that several patterns, including head-and-shoulders and double bottoms, did carry some incremental information about returns. That is a long way from saying they produce easy profits, but it shows the patterns are not pure superstition.
Does technical analysis work? What the research shows
The most widely cited review is Park and Irwin's 2007 survey in the Journal of Economic Surveys, which looked at decades of studies on technical trading rules. Its headline counts are below.
| Finding | What the review reported |
|---|---|
| Modern studies reviewed | 95 |
| Positive results for technical rules | 56 studies |
| Negative results | 20 studies |
| Mixed results | 19 studies |
| Early studies by market | Profits in currencies and futures, but not in stocks |
| Main caveats | Data snooping, rules chosen after the fact, and hard-to-estimate risk and costs |
On the surface, 56 out of 95 looks like a win. The caveats matter more, though. If researchers test hundreds of rules on the same data, some will look profitable by chance alone, which is known as data snooping. Rules picked with hindsight rarely work as well going forward. Costs such as spreads and slippage can also wipe out small edges, and the review noted that results were more consistent up to the early 1990s than afterwards.
The fair summary is that technical analysis is not useless, but any edge tends to be small, fragile and specific to a market and period. That fits what most retail forex traders experience, as our guide on whether forex trading is profitable shows.
What 230 robot reviews tell us
Forex robots and signal services are a useful real-world test, because most of them are technical rules turned into code or alerts. If chart rules reliably made money, the products built on them should score well. They mostly don't.
- Of 230 forex robots we rated, the average score was 4.35/10. Only 5 scored 8 or higher, 42 scored 6 or more, and 125 scored below 4.5.
- Of 27 signal services, the average was 4.3/10, just 1 scored 8 or higher and 14 scored below 4.5.
Common problems were over-fitted backtests, martingale or grid money management hiding the risk, and live results that looked nothing like the sales page. You can browse the full rankings in our forex robot ratings, and indicator products such as the TJ10X Forex Indicator review show how marketing claims compare with reality.
How to analyse stocks with technical and fundamental analysis
For most investors, the sensible answer to how to analyse stocks is to use both approaches for different jobs. Fundamental analysis asks whether a business is worth owning; technical analysis helps with when to buy, where to admit you are wrong and how much to risk.
| Fundamental analysis | Technical analysis | |
|---|---|---|
| Main question | What is it worth? | What is the price doing? |
| Inputs | Revenue, earnings, debt, cash flow, valuation | Price, volume, trend, volatility |
| Typical time frame | Months to years | Minutes to months |
| Best used for | Choosing what to own | Timing entries, exits and stop levels |
For the fundamental side, a company's annual report is the place to start, and the SEC's guide on how to read a 10-K explains its main sections.
How to do technical analysis of stocks without fooling yourself
- Start with the trend on a higher time frame. A daily or weekly chart shows whether you are trading with or against the main direction.
- Mark obvious levels. Recent highs, lows and ranges are where many traders place orders, so price often reacts there.
- Use one or two indicators, not ten. Many indicators are built from the same price data and simply repeat each other.
- Write the rule down before you test it. Exact entry, exit and stop rules make the idea testable and stop hindsight creeping in.
- Test on data you did not use to build the rule, then on a demo account, and include realistic spreads and commissions.
- Size positions so one loss is small. Risk control is where technical tools add the most value.
Limitations to keep in mind
Technical analysis cannot see news, earnings surprises or central bank decisions coming, and patterns fail often. Backtests flatter almost every rule, and an edge that works in one market or year may vanish in the next. Treat any product promising high win rates from a "secret" indicator with suspicion. Trading is risky and you can lose more than you expect, especially with leverage.
FAQ
Do technical analysis strategies work in forex?
Early research found technical rules did better in currencies and futures than in stocks, but profits became less consistent in later data and are easily eaten by spreads, so a forex rule needs careful out-of-sample testing.
What is technical analysis in investing?
For long-term investors it is mainly a timing and risk tool, used to avoid buying into a sharp downtrend or to set a level where the original idea would be proven wrong, while fundamentals decide what to own.
What are technicals in stocks?
Technicals are the chart-based features of a stock, such as its trend, moving averages, support and resistance levels, momentum readings and trading volume, as opposed to its earnings or valuation.
Is technical analysis better than fundamental analysis?
Neither is better in every case; they answer different questions, and many traders use fundamentals to choose a market and technical analysis to time entries, exits and position size.